Symbolic programming
Wolfram Language itself comes with a vast standard library, which is suitable for most problem solving, where Python or Julia are used.
The complexity for some utility tasks such as plotting data in the a given range might even be comparable with a level of Microsoft Excel.
Wolfram Language is symbolic programming language, which is in a nutshell
- code and data are expressions
- computations are executed by applying rules
- what you see is one of the forms of interpretation
Introduction
Let us have a look at an example
Integer numbers are so-called atoms of the language on which we can apply any transformation rule. Or we can use more general pattern
Here what you see
is actually written in the code editor as
(*FB[*)((1)(*,*)/(*,*)(2))(*]FB*)
Looking closely on it, we can se that the it is still a normal (1/2) expression like in any other programming language. However, it is wrapped with some special comment blocks, that tells an editor how to render it. One can go quite far with it
-c45244a98d39dfa819928354d1711ed6.gif)
Any output expression is editable and can be reevaluated as well
One can go even further in exploring the idea of symbolics and syntax sugar of our editor by applying more complicated rule
As one can see, Wolfram Language does not differentiate what you are entering: a color, a function, a number. All of them are normal Wolfram Language expressions.
There are also built-in expression used for styling the output
here % means to use the previous output
Or something more complicated
this expression will make an array of numbers and highlight primes
If you try to evaluate it, all decorations will be gone and you get a normal-looking Wolfram Language array with numbers up to 20.
The same symbolic features count for Graphics. For example
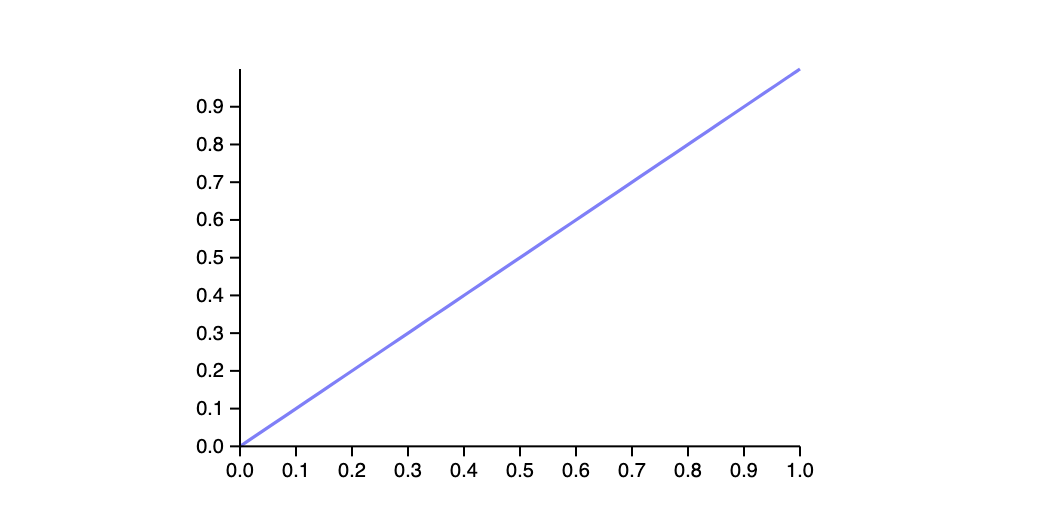
One might think, that this is an image, but not
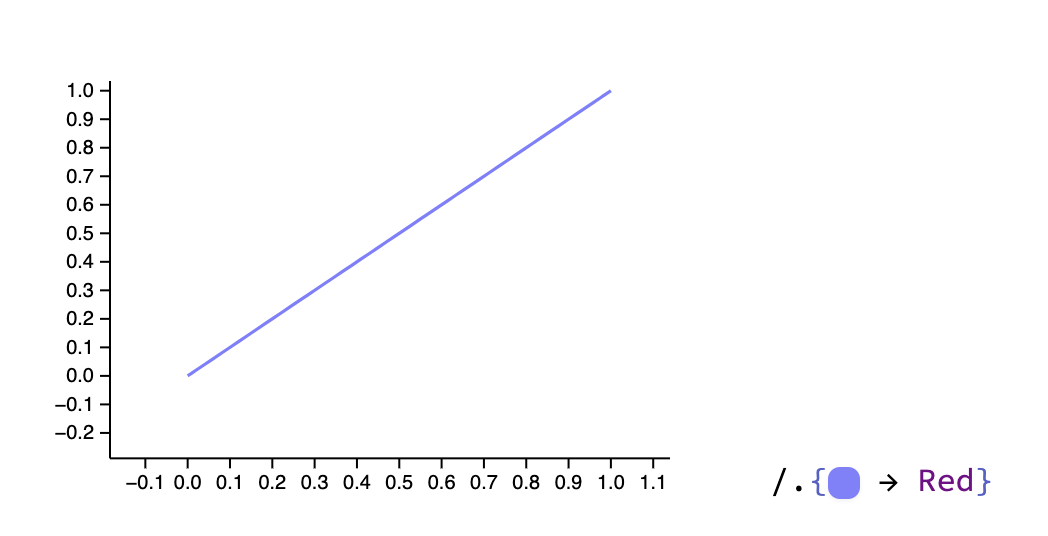
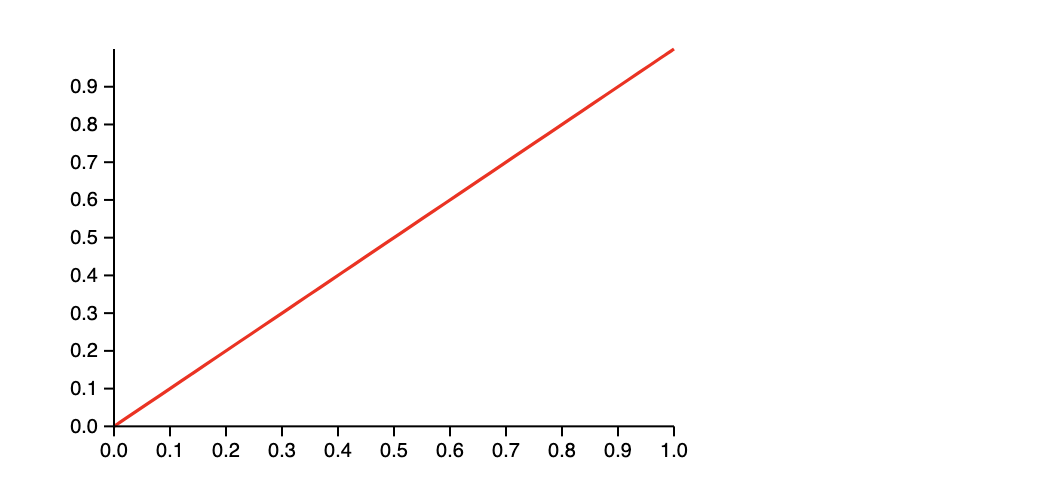
Everything is a set of Wolfram Expressions covered with a decoration. Underneath there is still a working code than can be copied
Most symbols are abstract objects that represent ideas, which, then can be interpreted in many ways.
This is also valid for 3D graphics
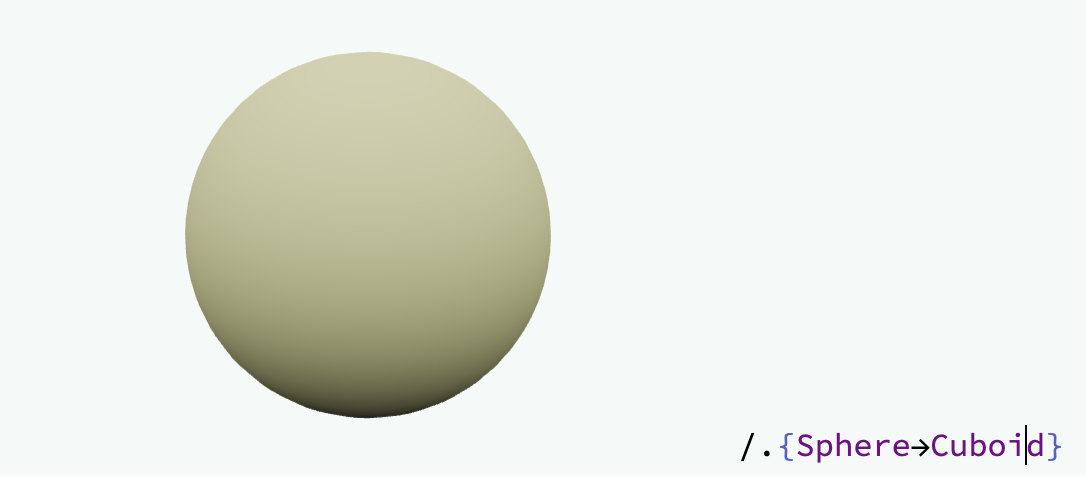
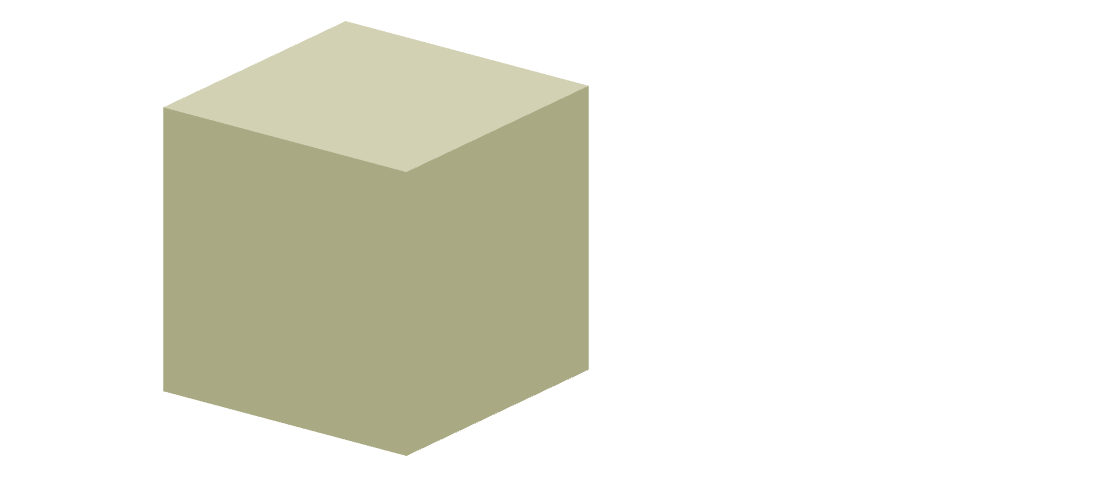
This is all a question of interpretation
What you see is only one form, however, taking the same symbol of Cuboid, we can treat it as a an abstract object that represents a corresponding geometric object, i.e.
Raster images are also expressions. Try to drag and drop your image to an editor

What can you do with it? Anything! For instance

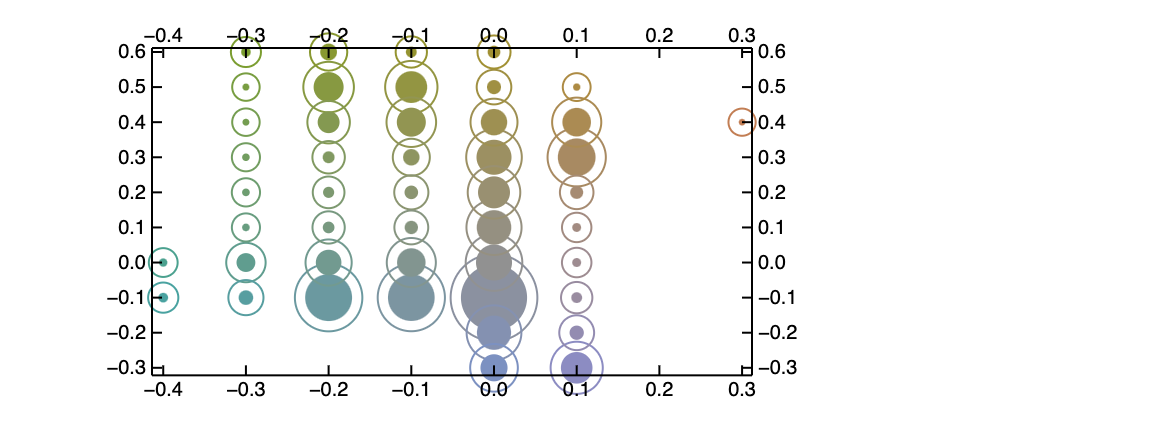
or analyze a color distribution in LAB space
If you like math like me, you will probably find it useful to work in MatrixForm
And it is still fine to work with it like if it was a normal list of lists (matrix)
Use Command palette for easy matrix drawing
Or combining it with other syntax sugar, one can do quite weird things
Syntax sugar and decorations also serves the purpose of abstracting classical OOP objects providing a short summary

which is still a normal symbol, which can be copied somewhere else.
For instance DateObject is rendered as a date
Time-series has also its own representation

Read more on how to create such object
Color data function will show the preview of color palette
ColorData[24]

And the last example of a syntax sugar is ListPlay, which is quite experimental, but allows to play or generate sound right in the notebook

If you have too much data, then turn it into an icon using Iconize

It uses zlib to compress it and store as BASE64 string inside the notebook. However, it the size does exceed a few kilobytes the data will be offloaded to a file and an icon will be turned into a short reference.
Those are built-in features, there is no extra privilege for them compared to user's code. You may implement your own objects with beautiful syntax sugar and etc.